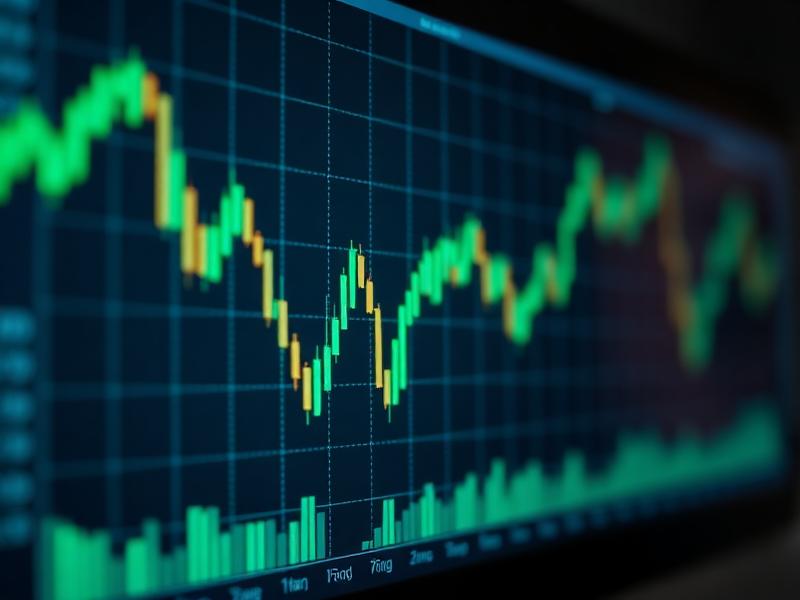
Technical analysis studies price and volume to judge the balance between buyers and sellers. It complements, but never replaces, fundamental research.
Reading the chart
Candlesticks show open, high, low and close for a period. Long upper wicks signal selling pressure into strength; long lower wicks signal buying into weakness.
Trend, support and resistance
A rising sequence of higher highs and higher lows defines an uptrend. Support is a price where buyers have repeatedly stepped in; resistance is where sellers have. Both matter more when volume confirms them.
Moving averages and momentum
The 50-day and 200-day moving averages smooth noise and frame the trend. Momentum tools such as RSI flag overbought and oversold conditions, which are signals to pay attention, not automatic trade instructions.
Applying it on the NGX
Many Nigerian stocks trade thinly, so single large orders can distort patterns. Always check volume before trusting a breakout, and use limit orders to control your fill.
Finished this lesson?
Create a free account to save your progress across devices.